
Exploring the Patterns in City’s Demographics from Heterogeneous Data
Analyzing and identifying patterns in multidimensional spatio-temporal data is challenging. In this work, we use time-series data exploration and brushing techniques to explore the financial journey of the city population in a spatio-temporal heterogeneous dataset. We also use force-directed graphs to investigate social isolation based on the financial status of the people in the city. The visualizations have been developed as an answer to the IEEE VAST 2022 Mini Challenge 1. We describe some interesting findings to be shared with the city's residents.
The work received an honorable mention for “Clear Articulation of Hypotheses and Metrics” and got accepted for publication in the IEEE VIS 2022 proceedings. To learn more about the dataset that is shown, visit IEEE VAST Challenge 2022.
Related links: Conference Paper | Demo | Observable Link 1 | Observable Link 2 | GitHub | Figma Design Board
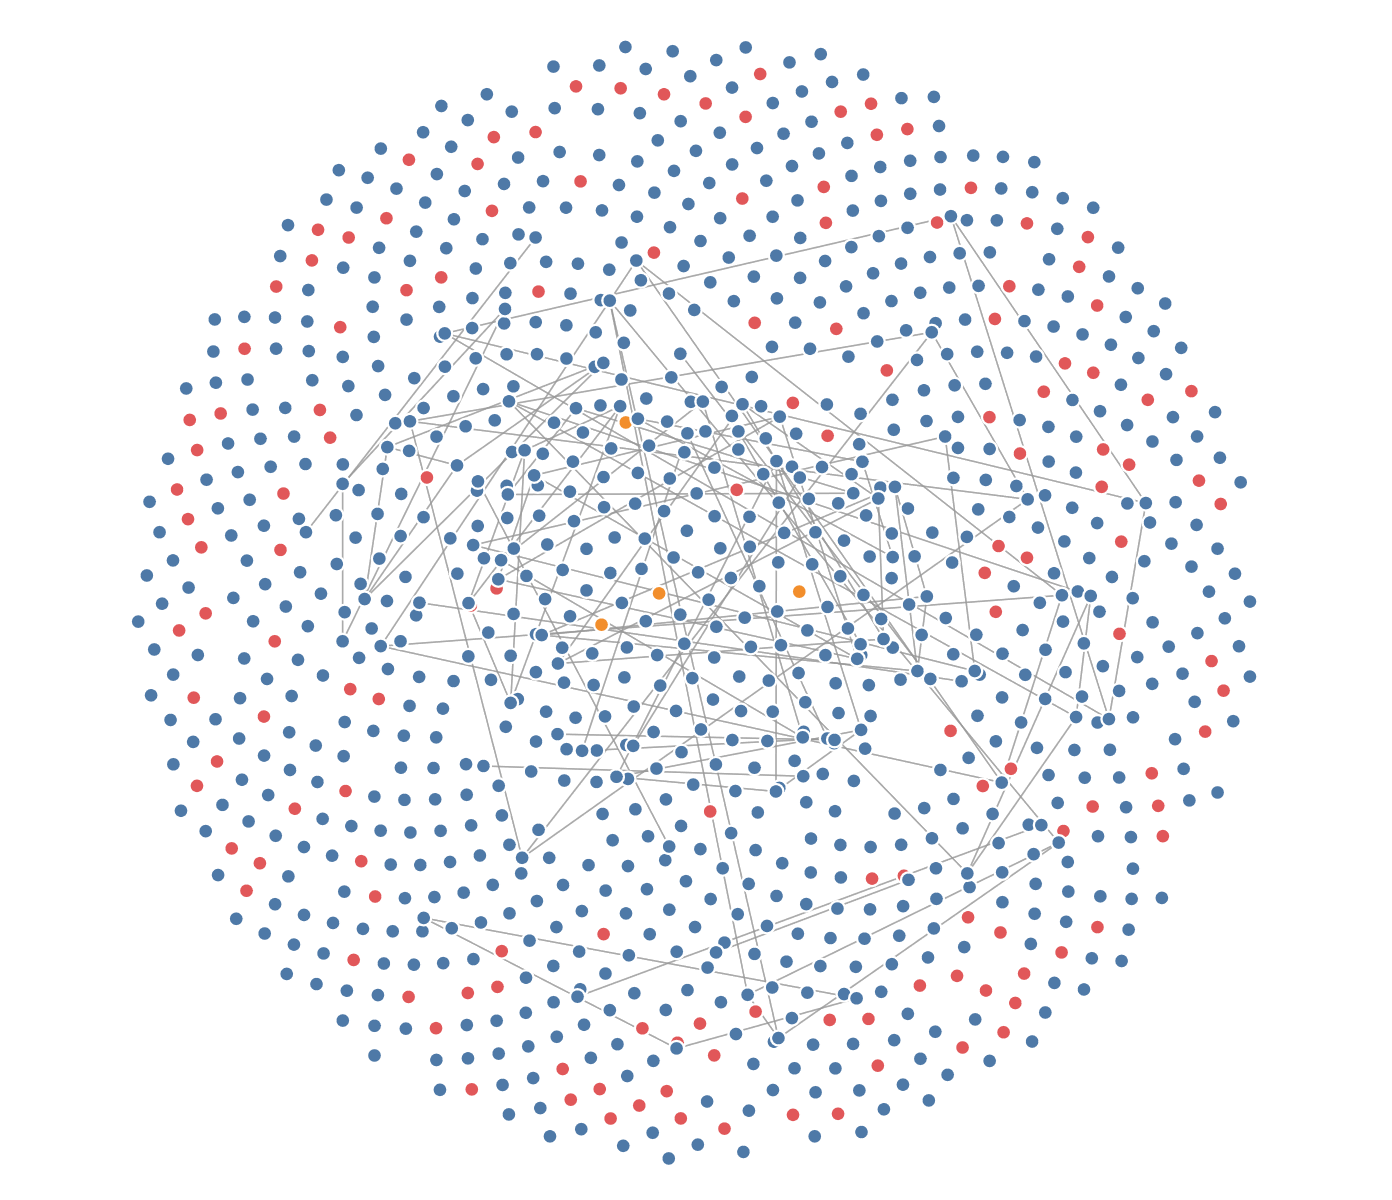
Force-directed graph depicting financial status of the city's population: March 1, 2022 at 00:00:00.
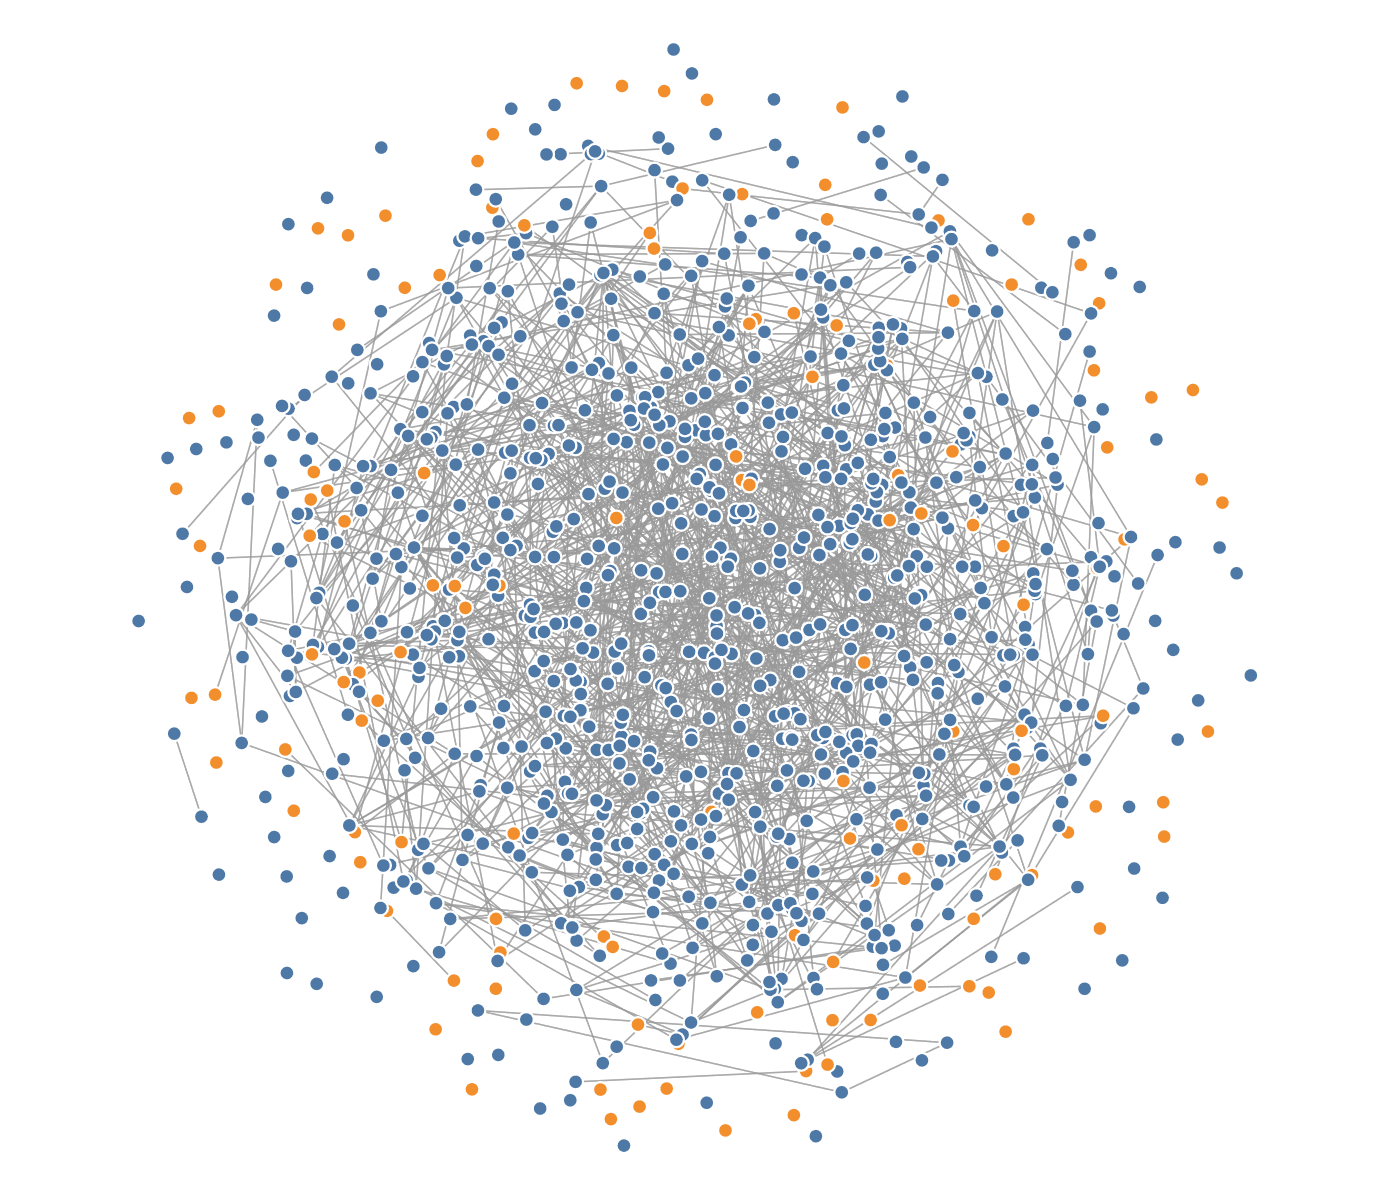
Force-directed graph depicting financial status of the city's population: Over the month of March 2022.

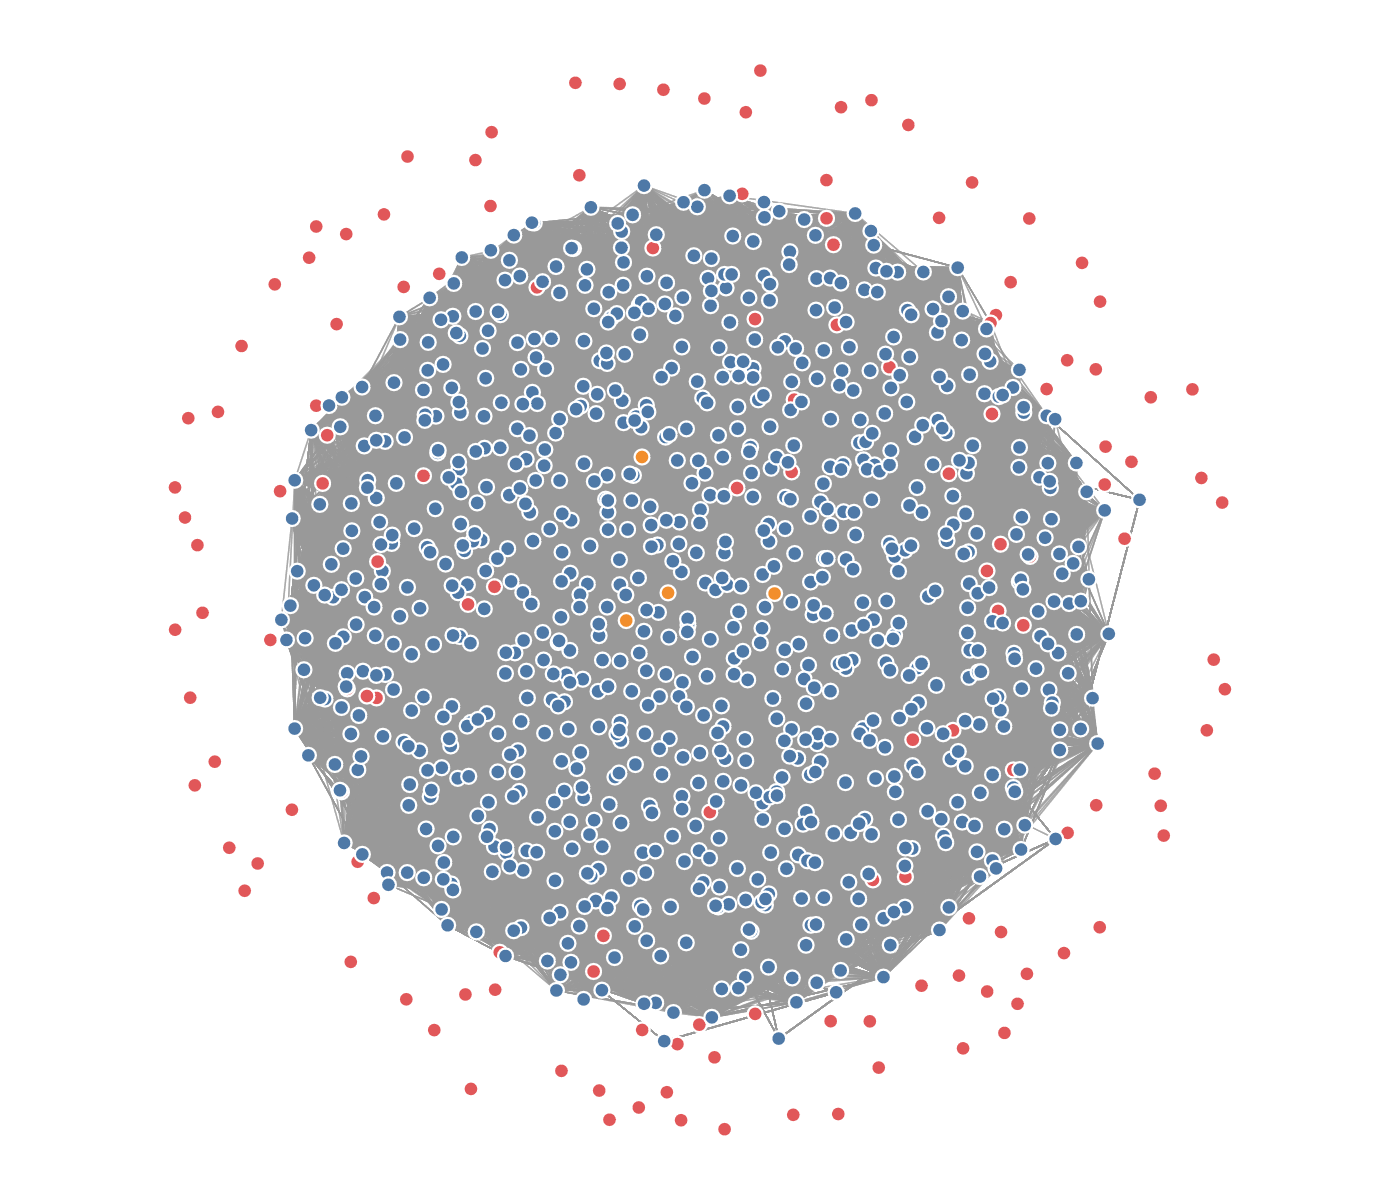
Force-directed graph depicting financial status of the city's population: March 1, 2022 00:00:00 to May 1, 2023 00:00:00.

Labels for population's financial status.
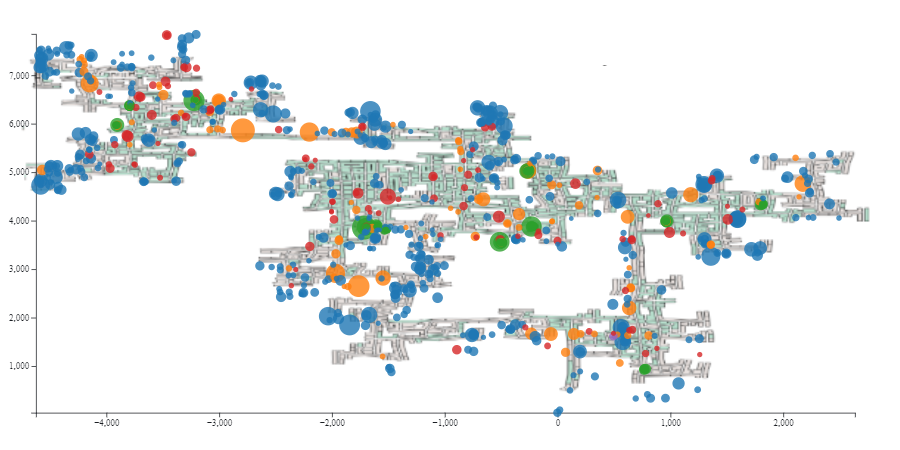
Weekend activities of the city population: Saturday, April 23, 2022 at 10:00:00.
Force-directed graph depicting financial status of the city's population: March 03, 2022 00:00:00.
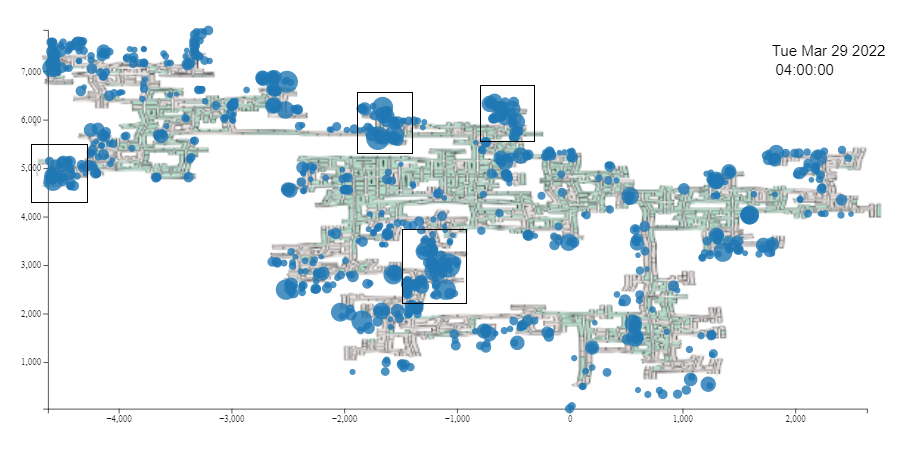
Financial journey of the city towards the end of the month: March 29, 2022 at 04:00:00. Affluent neighborhoods are highlighted in square boxes.

Labels for population's current mode.
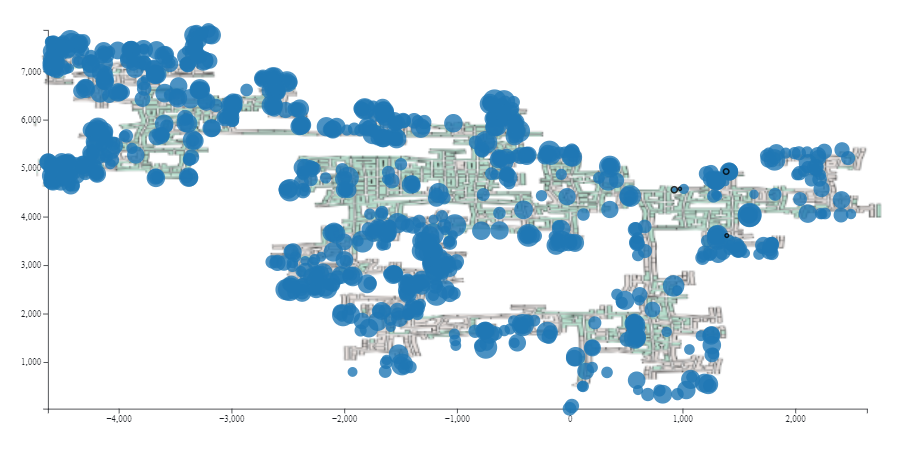
Financial journey of the city at the start of the month: March 01, 2022 at 04:00:00.
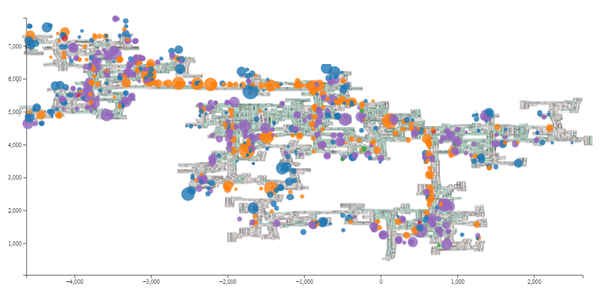
Transportation pattern highlighted by orange-colored spheres on a weekday: Thursday, March 17, 2022 at 08:00:00.